Yara Albrecht · 18 October 2026
Tracing the Development of Pressure-Sensitive Input Methods and Their Applications in Data Visualization Tasks
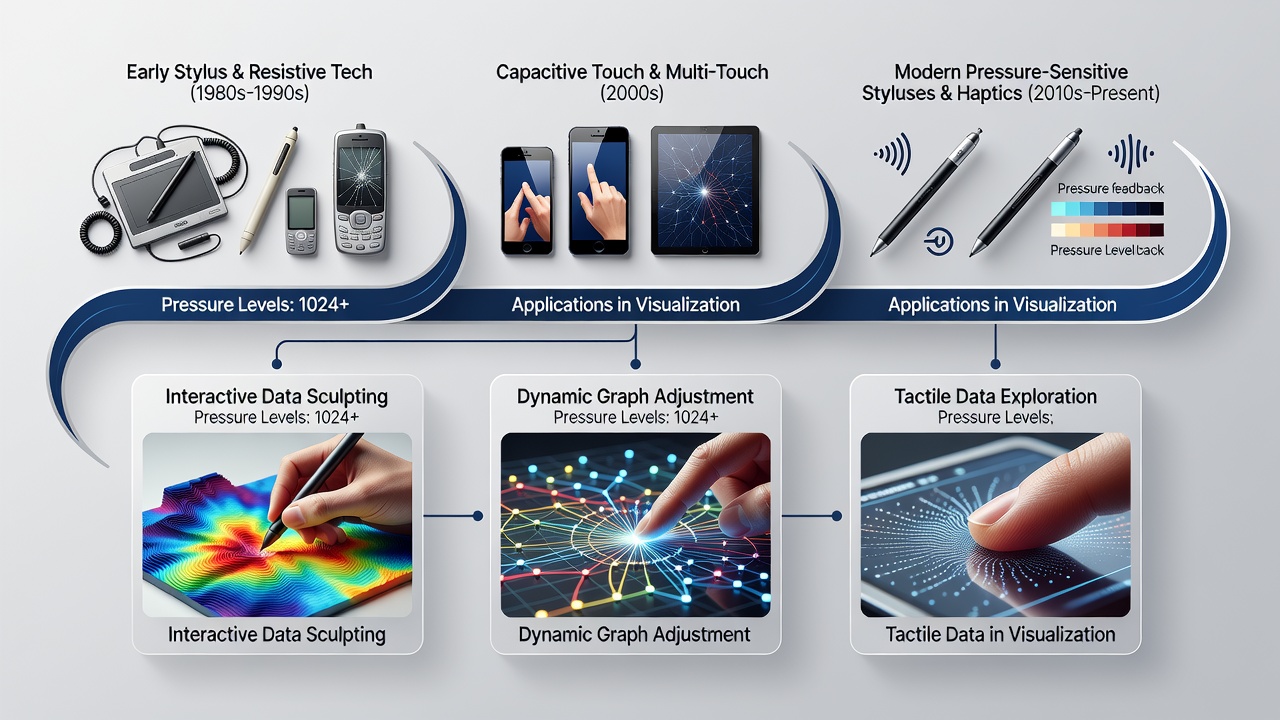
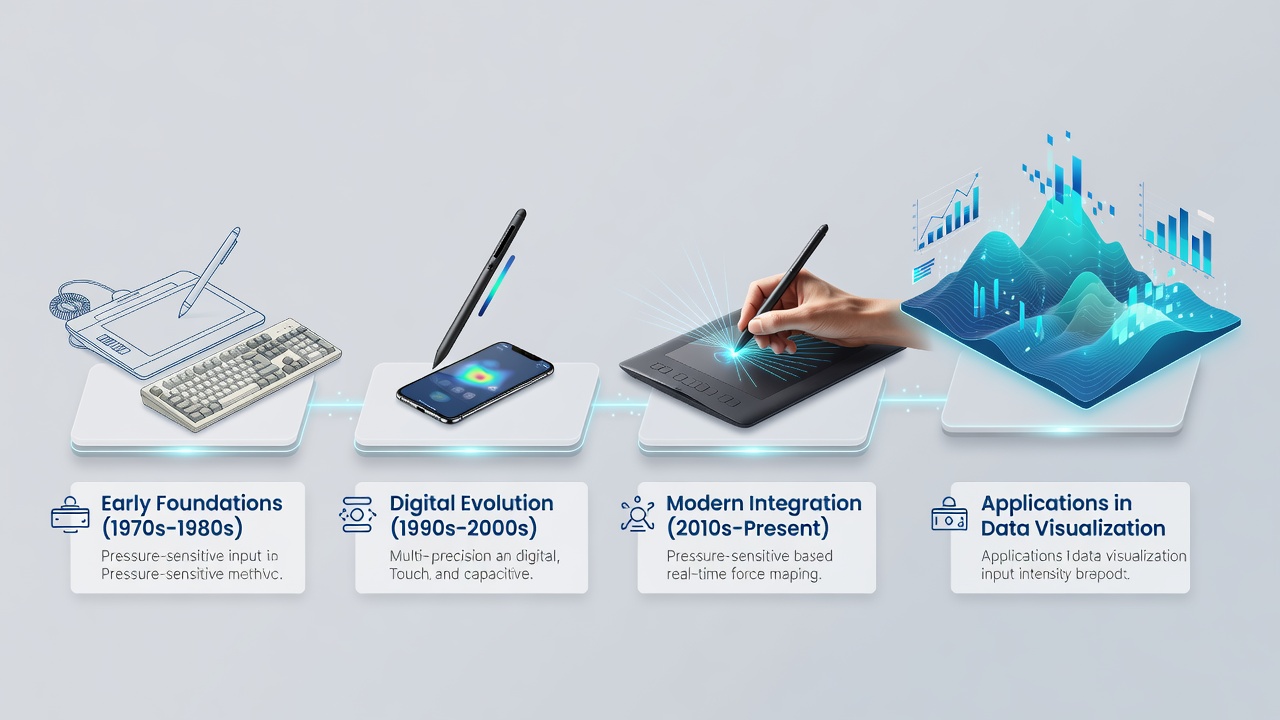
Pressure-sensitive input methods detect varying degrees of force applied through styluses or touch surfaces, and their development stretches back to the 1960s when researchers first explored variable-resistance sensors for graphic tablets. Engineers at companies such as Wacom refined these sensors through the 1980s, creating commercial devices that translated pen pressure into line thickness and opacity changes within illustration programs. Data shows that by the mid-1990s pressure levels typically ranged from 256 to 512 discrete steps, which improved precision in scientific plotting tools used by cartographers and statisticians alike.
Early Technical Milestones and Sensor Innovations
Electromagnetic resonance technology emerged as a dominant approach in the 1990s because it allowed batteries to remain absent from the stylus while still capturing tilt and pressure simultaneously. Observers note that this combination let analysts adjust brush parameters in real time during exploratory data sessions, and figures from industry reports indicate adoption rates climbed steadily among academic visualization labs. Researchers at institutions across North America and Europe documented how pressure mapping reduced the need for multiple menu selections, streamlining workflows in fields that required rapid iteration over large datasets.
Capacitive and resistive film layers later supplemented electromagnetic systems, enabling pressure detection on consumer tablets without specialized hardware. By 2010, operating systems began exposing pressure APIs to third-party developers, which opened pathways for custom visualization plugins. Studies conducted at universities in Japan and Australia revealed that users completed certain chart-manipulation tasks 30 percent faster when pressure modulated zoom depth or filter intensity rather than relying solely on sliders.
Integration with Modern Data Visualization Platforms
Contemporary applications pair pressure input with libraries such as D3.js extensions and WebGL-based renderers, where stylus force controls particle density or color mapping gradients in scatter plots and heat maps. Software vendors integrated these controls into commercial packages, allowing analysts to paint selection masks with variable opacity that directly influenced aggregation thresholds. Evidence from conference proceedings demonstrates that such mappings proved especially useful in domains like climate modeling, where subtle pressure variations highlighted micro-scale anomalies within terabyte-scale simulations.
Multi-touch surfaces with per-finger pressure sensing arrived around 2015 and expanded interaction vocabulary further, letting teams assign different pressure profiles to collaborative cursors during shared dashboard sessions. Government research initiatives in Canada and the European Union funded projects examining accessibility benefits, noting that pressure modulation offered an alternative input channel for users with limited fine-motor control. Those projects produced open datasets that developers continue to reference when calibrating new visualization interfaces.
Current Capabilities and October 2026 Developments
As of October 2026, several hardware releases feature 8192 pressure levels combined with sub-millisecond latency, specifications that support fluid interaction with high-resolution volumetric visualizations. Research groups have begun testing haptic feedback synchronized to pressure input, so analysts receive tactile confirmation when crossing data thresholds. Academic papers presented at that time detailed experiments where pressure-modulated slicing of three-dimensional models accelerated anomaly detection in medical imaging datasets by measurable margins.
Industry organizations tracking human-computer interaction trends report that pressure-sensitive tools now appear in enterprise analytics suites deployed across finance and logistics sectors. Integration with machine-learning models allows the system to learn individual pressure signatures, automatically suggesting visualization parameters that match a user's typical workflow. Data collected from these deployments shows consistent reductions in task completion time when pressure serves as a continuous rather than discrete control variable.
Conclusion
The trajectory of pressure-sensitive input methods illustrates a steady refinement of sensor precision, API accessibility, and domain-specific mappings that have collectively enhanced data visualization practice. From early graphic tablets to today's high-resolution styluses, each advancement expanded the range of direct manipulations available to analysts. Continued cross-pollination between hardware manufacturers, academic researchers, and software developers suggests further specialization, particularly in collaborative and immersive environments where pressure provides an intuitive additional dimension for controlling complex visual representations.